Measuring Success: Key Metrics to Track for Your Advertising Display Digital Signage Campaign

Measuring success in digital signage campaigns is very important for any business that wants real results. Many marketers wonder how to know if digital signage works and if a campaign gives value. The answer is to track key metrics like impressions, reach, click-through rate, conversion tracking, foot traffic, sales data, and return on investment. By always measuring digital signage success, organizations get clear information. These metrics help teams improve strategies, make better content, and get better campaign results and ROI in many industries.
Key Takeaways
Watch important numbers like impressions, engagement, conversion rate, and ROI to see if your digital signage works. - Make clear SMART goals so your campaign matches the right performance numbers. - Use tools like sensors, QR codes, and sales data to see how people use your signage. - Look at numbers that show real results, not just ones that look good. - Check your data often and use it to make your content better, get more customers interested, and sell more.
Key Metrics for Digital Signage
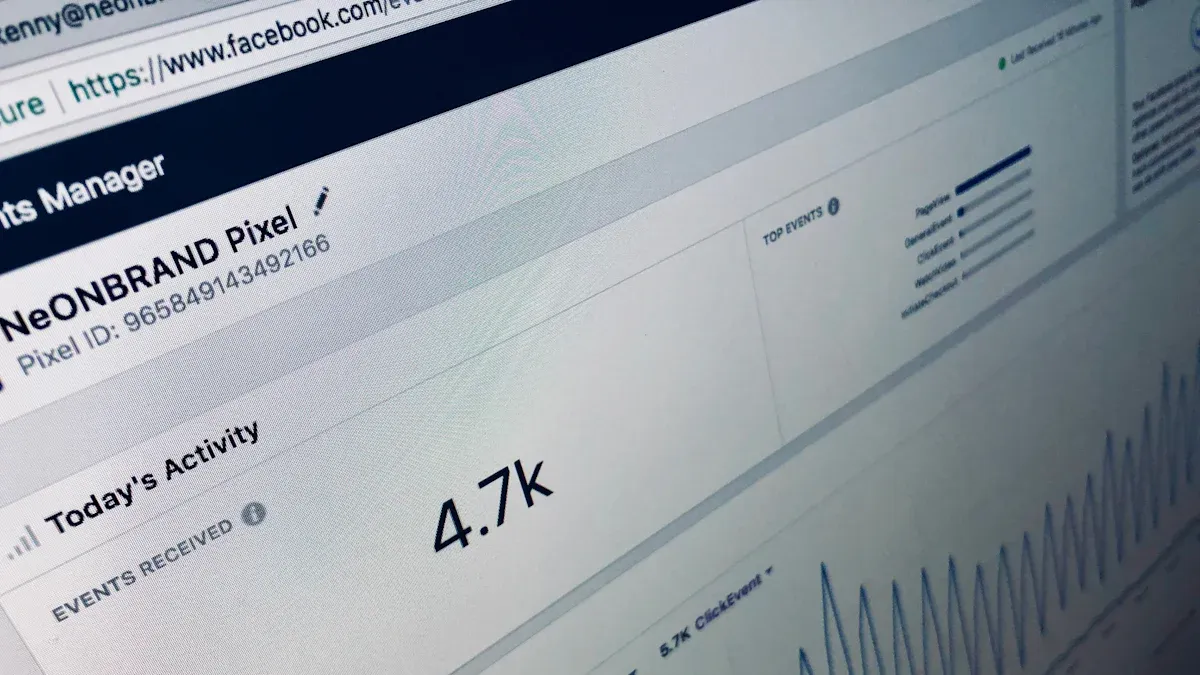
Impressions and Views
Impressions and views are important numbers for digital signage. They show how many times people see the screen content. If impressions are high, more people notice the brand. This helps more people know about the message. Studies say 70% of Americans saw digital video displays last month. Only 43% saw Internet ads, and 41% saw Facebook ads. Digital billboards have a 75% recall rate in a month. Digital signage gets lots of impressions every day. Static signs get the most views on day one, then drop. The table below shows these results:
Study Aspect | Findings |
|---|---|
Percentage of Americans seeing digital video displays in past month | 70% (vs 43% Internet, 41% Facebook) |
Travelers recalling digital billboards | 75% recall within past month |
Impressions trend for static signs | Peak on first day, then drop and remain low |
Impressions trend for digital signs | Consistently high impressions daily |
Consumer action prompted by signage (free tote bags) | 6 people with static signs vs 610 with digital signs |
These numbers help companies see how far their ads reach. They can use this to put content in better spots.
Engagement Rate
Engagement rate shows how much people interact with digital signage. It is more than just looking at the screen. It counts touches, scans, or answering calls-to-action. A high engagement rate means people like the content and join in. In hotels, 70% of guests enjoy digital signage. In restaurants, 79% of customers think tech makes eating better. Employee engagement goes up by 350% with digital signage. Also, 80% of viewers buy things after seeing digital ads. The chart below shows engagement rates in different places:
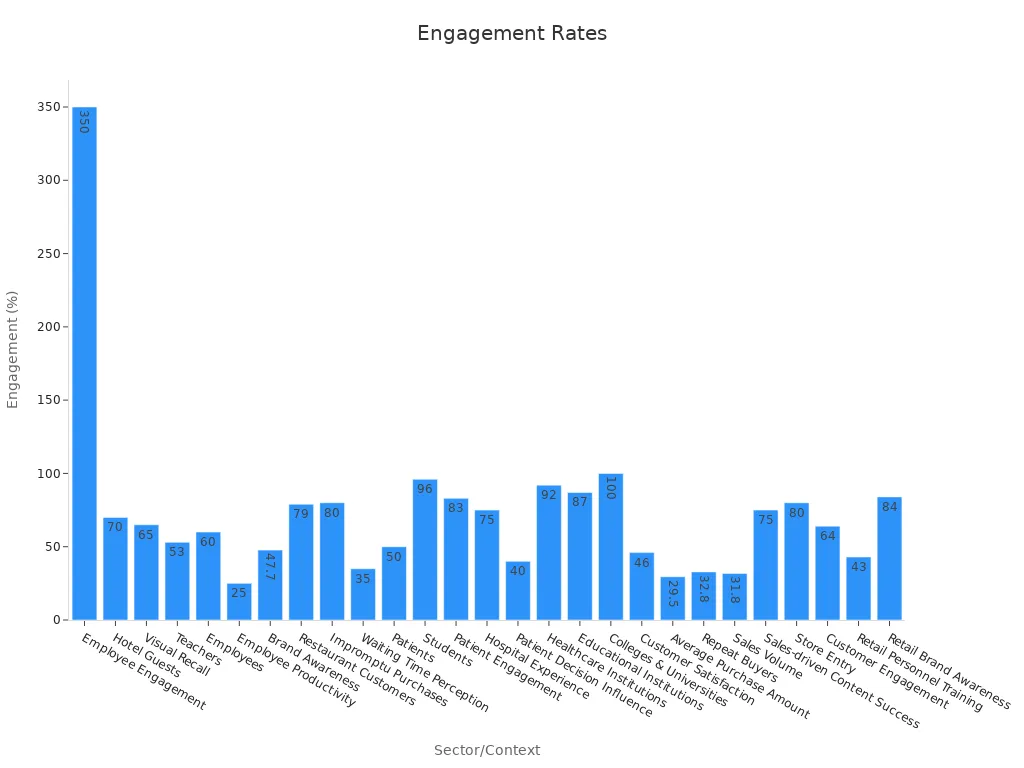
Tracking engagement rate helps teams make better content and get better results.
Dwell Time
Dwell time is how long people look at digital signage. This tells if the content is interesting or not. Longer dwell time means people pay more attention and remember more. Where the sign is placed changes dwell time a lot. For example:
Environment | Average Dwell Time (seconds) | Notes on Content/Context |
|---|---|---|
Restaurant Digital Menu | 7 - 12 | Customers deciding orders; clear layouts, animations extend time |
Transportation Hubs | 15 - 20+ | Travelers engage with flight info, ads, interactive kiosks |
Healthcare Waiting Rooms | 10 - 15 | Calming content, health tips, queue info during idle periods |
Events and Conferences | 20+ | Directions, speaker info, schedules; high content relevance |
Watching dwell time helps companies change content length and style to keep people watching.
Conversion Rate
Conversion rate is a very important metric for digital signage. It shows what percent of viewers do something you want, like buy something or sign up. High conversion rates mean the campaign works well and helps make money. For example, 80% of people go into stores after seeing digital signage. Also, 19% buy things they did not plan to buy because of these ads. By checking conversion rates, businesses can see how digital signage helps sales and ROI.
Click-Through Rate (CTR)
Click-through rate (CTR) is the percent of people who click a link, scan a QR code, or use interactive parts of digital signage. There is not much direct CTR data for digital signage. Online display ads have a 0.1% CTR, but personalized ads can get 2.3%. Digital signage is good at making people act in person. For example, 80% of people go into stores after seeing digital signage. Also, 29.5% buy from digital menus. These numbers show digital signage can make people act fast.
Tip: Use QR codes and special URLs to track CTR and see how well your campaign works.
Cost per Conversion
Cost per conversion is how much money is spent for each action, like a sale or sign-up. This helps companies see if their digital signage is worth the cost. Lower cost per conversion means more actions for less money. This makes ROI better. By looking at this number with other metrics, businesses can spend money smarter and earn more.
Return on Ad Spend (ROAS)
Return on ad spend (ROAS) shows how much money is made for every dollar spent on digital signage ads. This is key for knowing if a campaign makes money. For example, LED signs can get 1,000 views for only $0.15. This is a cheap way to reach lots of people. High ROAS means the campaign brings in more money than it costs. Watching ROAS with other metrics helps make sure marketing money is well spent.
Foot Traffic
Foot traffic counts how many people go into a store after seeing digital signage. This is very important for stores. Research says digital signage at store fronts can raise foot traffic by 17%. By tracking foot traffic, businesses can see if their ads bring in more customers and more sales.
Viewer Demographics
Knowing viewer demographics helps companies make digital signage for certain groups. Important groups are age, gender, location, income, education, and interests. Using data like buying history or social media helps split audiences even more. Showing content at the right time for each group gets more people to watch and act. Surveys on digital signage help collect new demographic data. This keeps content useful and interesting.
Return Visitors
Return visitors are people who see digital signage and come back again. Many campaigns see almost 30% more repeat visits. This shows digital signage helps keep customers coming back and spending more. By tracking return visitors, companies can make better plans to keep people interested and improve ROI.
Measuring Success with Digital Signage Analytics
Setting SMART Goals
Every digital signage campaign should have clear goals. SMART goals help teams know what to focus on. SMART means Specific, Measurable, Achievable, Relevant, and Time-bound. For example, a store may want 15% more people to visit in three months. Another goal could be to get 200 more QR code scans each week. These goals help teams pick the right digital signage KPIs and display advertising KPIs. Teams use these goals to check how well they are doing and see if they make more money. Setting SMART goals makes it easier to see if the campaign works.
Tip: Write down each goal and talk about it with your team before you start the campaign.
Aligning KPIs with Objectives
KPIs are key performance indicators. They show if a campaign is meeting its goals. Teams need to match KPIs to what the campaign wants to do. If the goal is to sell more, use revenue and conversion rate as digital signage KPIs. If the goal is to get people to interact, use customer engagement KPIs like dwell time and interaction rates. Display advertising KPIs like impressions, click-through rates, and foot traffic also help measure how well things are going. Picking the right KPIs makes sure digital signage analytics give good data for checking performance and making choices.
Tracking Campaign Performance
Digital signage analytics tools help teams see how campaigns are doing right now. There are many ways to measure success. Google Analytics and Adobe Analytics track website visits from special links. Dynamic QR codes show how many people scan and interact. Sensors count how many people walk by and see the signs. Geofencing tools show how many people come to the store during a campaign. Sales tracking links money earned to each digital signage campaign. The table below lists some common analytics tools and what they measure:
Analytic Tool / Method | What It Measures | Example Metrics / Outcomes |
|---|---|---|
Google Analytics / Adobe Analytics | Website visits from campaigns | Visitors from special URLs, conversion rates |
Custom URLs with UTM Parameters | Where traffic comes from and how to track it | Visitors from billboard campaigns |
Dynamic QR Codes | How many people interact in real time | QR code scan rates, user interactions |
Sensors (e.g., mobile detection) | How many people see the signs | Foot traffic counts, peak viewing times |
Geofencing / Location Data | Who visits the store and where they are from | Store visits, audience location data |
Sales Tracking | How much money comes from the campaign | Online and in-store sales linked to campaigns |
By using these analytics tools, teams can watch display advertising KPIs, digital signage KPIs, and how the campaign is doing. This helps teams keep checking performance and make future campaigns better.
Choosing the Right Metrics
Matching Metrics to Campaign Goals
Picking the right metrics starts with knowing your campaign’s main goal. Each digital signage campaign can have a different goal. Some want to sell more, get people to interact, help people find things, or get more social media attention. Teams should match each kpi to the goal for better tracking. For example, use views and engagement rate as kpis if you want more people to know your brand. If you want to make more money, track conversion rates and sales. For interactive campaigns, count QR code scans or screen-only URLs. Collect feedback to make the customer experience better. Teams should use software with good analytics and reporting tools to watch these kpis. Cloud-based tools help teams change digital signage plans over time. Putting screens where lots of people walk by makes display advertising metrics stronger. SMART objectives help make sure each kpi is clear, can be measured, can be acted on, fits the goal, and has a deadline. This way, metrics help both ROI and ROO, so every campaign works better.
Interactive vs. Static Content
The kind of content changes which metrics are most important. Interactive digital signage uses things like touchscreens and motion sensors. These features make people pay more attention and enjoy the experience. The table below shows how interactive and static signage compare:
Metric/Aspect | Interactive Digital Signage | Static Signage |
|---|---|---|
Attention Capture | 63% report higher attention | Lower |
Brand Awareness Increase | Up to 47.7% increase | Not measured |
Average Purchase Amount | Up to 29.5% increase | Not measured |
Sales Impact | 20% sales increase, 98% satisfaction (case study) | Not measured |
Engagement | Higher due to interactivity | Lower, no interactivity |
Content Update Flexibility | Real-time updates | Requires reprinting |
Cost (Initial/Updates) | Higher upfront, low update cost | Lower upfront, high update cost |
ROI | Higher over time | Lower due to update costs |
Interactive content lets you track more advanced kpis, like dwell time and user actions. Static content only uses basic display advertising metrics.
Avoiding Vanity Metrics
Some metrics do not really help. Vanity metrics, like total impressions without details, may look good but do not show real results. Teams should focus on kpis that help reach business goals. For example, do not just count views. Measure how many people take action or come back. This helps digital signage give a better customer experience and helps the business grow.
Tip: Always check which kpis give real results and change your plan to focus on the ones that matter most.
Best Practices for Digital Signage Analytics
Data Collection Methods
Good data collection is the base for strong digital signage analytics. Teams should use random and fair samples to make sure data is correct. They need to show and explain data in a simple way so no one gets confused. Being open about how they collect data, including any problems or mistakes, helps people trust the results. Working with others to check the data and learning new ways to study data makes the process even better.
Use sensors, QR codes, and special URLs to get live data.
Connect sales and business systems for a full picture.
Be careful with missing data and say how it affects results.
Check for bias and other problems so results are not wrong.
Tip: Always write down how you collect data and share it with everyone to stay honest.
Analyzing and Interpreting Results
Teams should pick the most important metrics that fit their business goals, like how much people interact, how many buy, or how far content spreads. Setting clear goals using SMART goals helps teams match digital signage results with what they want. Using tools like cost-benefit analysis and attribution modeling shows how campaigns help make money and work better. Getting starting data before a campaign helps teams see real changes.
Pick metrics that match what the campaign wants.
Compare new data to what you had before.
Use interactive content and count people to see engagement.
Mix digital analytics with sales data for better understanding.
Checking data all the time helps teams change content and make campaigns better.
Acting on Insights
Using what you learn from data helps get better results and more money. Stories show that companies who change their digital signage after looking at data see big improvements. For example, a fast food place in New York City used video analytics to show different ads, which made sales of some products go up by 800%. BurgerFi added self-service kiosks, and ticket size went up by 18.5%. Supreme Foods used digital signs for workers, which made service faster and complaints go down.
Case Study | Key Change | Result |
|---|---|---|
NYC Fast Food Chain | Used dynamic visuals and real-time analytics | 800% more sales for certain products |
BurgerFi | Added self-service kiosks and upsell prompts | 18.5% bigger average ticket |
Supreme Foods | Used digital signs for staff communication | Faster service, fewer complaints |
Living Retail Lab | Sent messages when customers acted | More sales and better customer engagement |
Teams who use what they learn from analytics can make better content, give customers a better experience, and get the best results from their campaigns.
Overcoming Measurement Challenges
Ensuring Data Accuracy
Good data is very important for analytics to work well. Teams need to make sure sensors, QR codes, and sales systems work right. They should check these tools often to find mistakes or missing info. Staff must learn how to use the tools and write down results the right way. Writing down how data is collected helps everyone trust the process. Teams can use random samples so the data shows what real people do. If some data is missing or does not match, teams should write it down and change their study. Checking and fixing data often keeps it true and helpful for making choices.
Adapting to Change
People and markets change fast. Teams must be ready to change too. Some good ways to do this are:
Use data to see how people react and change content fast.
Change digital signage often so it stays interesting.
Link digital signage with other marketing like WhatsApp for a smooth brand feel.
Add things like touchscreens or QR codes to get people to join in and learn more.
Learn about the audience to make messages that fit each group.
Teach staff how to use new tools and ideas for better results.
Wavetec worked with Muscat Securities to show why quick updates matter. They showed new financial info to keep investors up to date and interested.
Teams that change fast can handle new problems and keep campaigns working well. Updating often and caring about what people want helps get good results.
Checking and improving your digital signage campaign all the time helps it work better. Teams need to watch these key performance indicators:
Audience engagement
Content effectiveness
ROI
Brand awareness and recall
Conversion rates
Customer feedback and satisfaction
Operational efficiency
Looking at analytics often helps teams make content better and increase roi. You can start by checking how your campaigns are doing now or by trying new analytics tools. Always working to get better brings stronger results and helps your business grow for a long time.
FAQ
What is the most important metric for digital signage campaigns?
The most important metric changes with each campaign goal. If you want more people to know your brand, impressions are key. If you want more sales, focus on conversion rate. Teams should always pick metrics that match what they want to achieve.
How can businesses track foot traffic from digital signage?
Businesses use sensors, cameras, or mobile tools to count people. These tools help show how many visitors see the signage and walk into the store.
Why should teams avoid vanity metrics?
Vanity metrics may look good but do not show real results. Teams should use metrics that help reach their goals, like conversions or engagement, to make better choices.
Can digital signage measure customer engagement in real time?
Yes. Interactive screens, QR codes, and sensors give live data. Teams can see how many people interact and change campaigns quickly.
How often should teams review digital signage analytics?
Teams should check analytics at least once a week. Regular checks help find trends, fix issues, and make campaigns better faster.
See Also
Maximizing Return On Investment Through Digital Signage Setup
How Digital Signage Influences Business Growth And ROI
Enhancing Customer Engagement With Digital Display Signage
Steps To Optimize Digital Signage Monitors For Best Results
Exploring Technology Benefits And Strategies For Digital Signage